If your sights are set on attending an ivy league school, you will want to score within the 99th percentile on the SAT or ACT.
While it’s possible to earn an 800 on the SAT Math section or to get a perfect score on the ACT Math section, doing so will require you to have a strong understanding of how to read and interpret graphs.
Both the SAT Math section and the ACT Math section include questions that require you to interpret data from graphs, graph linear equations, and analyze graphs of nonlinear equations and scatter plots among other topics.
To answer these questions, you will need to be familiar with quadrant charts and the four graph quadrants.
What are the four graph quadrants?
When you look at a graph, you typically see a horizontal line (x-axis) that intersects with a vertical line (y-axis).
These two perpendicular lines form what is called a Cartesian plane, where the intersection point is known as the origin.
The two intersecting lines of this Cartesian plane form four quadrants.
Each of these quadrantsencompasses a particular range of the graph, which are composed of either positive or negative x-axis and y-axis values. Understanding the differences between these quadrants and their values will help you interpret graph data when you take the SAT or ACT:
Quadrant 1
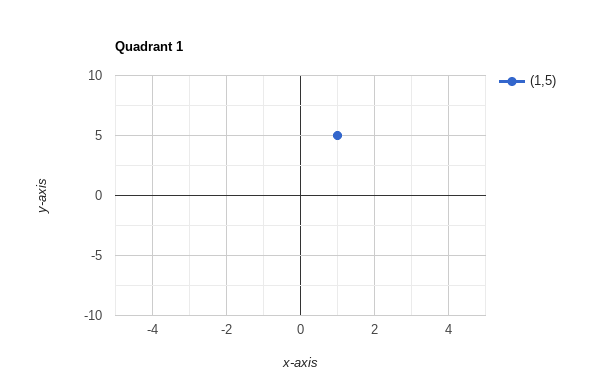
Quadrant 1 is always in the upper right corner where both the values for x and y are positive. The blue dot above is a representation of (1,5) where the value of x=1 and the value of y-=5.
Quadrant 2

Quadrant two is in the upper left corner. When you look at data within this quadrant, the value of x will always be negative, and the value of y will be positive.
The blue dot above represents (-2,5) on the graph.
Quadrant 3

Quadrant three is on the lower left hand side of the graph. In this quadrant, both the values of x and y are negative. The blue dot above represents (-2,-5) on the graph.
Quadrant 4
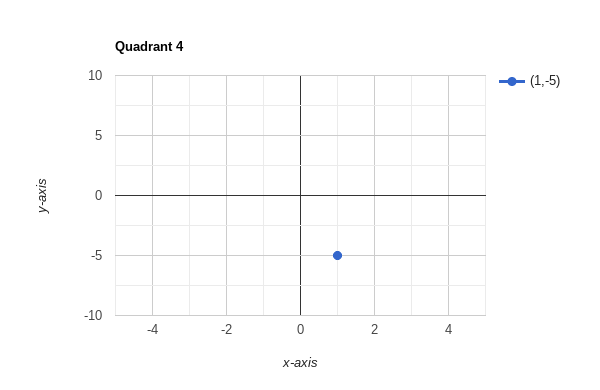
Quadrant four is the lower right quadrant of a graph. In this quadrant, the values for x are always positive while the values for y are always negative. The blue dot above represents (-1, -5) on the graph.
Interpreting data within the four graph quadrants
As mentioned above, any point on a graph represents some value of x and y. These values are known as ordered pairs, where the first value represents x and the second value represents y.
This means that anytime you are asked to interpret data that falls within quadrants 1 or 4, the first number (representing x) will always be positive, and anytime you are asked to interpret data that falls within quadrants 2 or 3, the first number will be negative.
Likewise, if you see a point in quadrants 3 or 4, they will have a negative y-value, and any points in quadrants 1 or 2 will have a positive y-value.
For instance, say you were asked to identify the quadrant where you would plot (4,-8). Because the x-value is positive and the y-value is negative, this would fall in quadrant 4. Or, for example, if you were trying to plot (-2, 5), this point would fall in quadrant 2 because the x-value is negative and the y-value is positive.
Once you are able to plot points on a graph and identify ordered pairs when they appear on a graph, you will be able to track trends that may be present on a graph.
Always read graphs left to right when analyzing trends and interpreting graphs on the SAT and ACT.
Consider the sample graph below that keeps track of population growth across time:
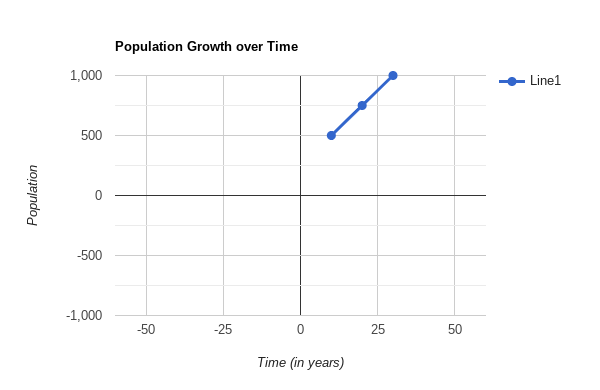
As you can see in the graph above, which is entirely in quadrant one, as the time increases, the population also increases, and both values remain positive.
Understanding the four graph quadrants
While this guide is a good starting point, you will need more practice with graphs before you are ready to take the SAT or ACT.
If you need help understanding the four graph quadrants and how you will use them on the math sections of standardized tests, consider working with a private math tutor.
Working with a private tutor will help you stay on track with a variety of math concepts that are tested on the SAT and ACT, including studying and interpreting graphs.
Get started with a tutor through Prep Expert® today when you visit our website.

Written by Prep Expert
More from Prep Expert


Essential Test-Taking Strategies for Multiple Choice Exams
Some students breathe a sigh of relief when they hear that a test will be multiple choice. However, multiple choice…

Why Grade Inflation Will Bring Back Test Scores In College Admissions
The average GPA for high school students in the United States is at an all-time high. However, research indicates that…

Digital SAT vs Digital ACT
Choosing between the SAT and ACT has always been a difficult task for high school students. With the recent announcements…