Understanding Percentile Scores On The SAT

What on earth does your NRSP percentile score mean? What about your SAT User Percentile? Are they important? How do they relate to your scaled score out of 1600? Will they help you get into your dream school – or not?
This post will cover what a percentile score represents, the relationship between SAT percentile scores and scaled scores out of 1600, why this relationship matters, and the exact meaning of the two percentile scores you receive.
[sat_one]
If you’re looking for better results on your SAT, check out our SAT prep course.
What Is A Percentile Score?
A percentile score on a standardized test indicates the percentage of other test-takers who scored lower than you did.
In other words, if you scored in the 65th percentile, then you did better than 65% of other test-takers. For instance, Prep Expert®’s instructors, each of whom has scored in the 99th percentile on the tests he or she teaches, beat 99% of all other takers of that test.
Additionally, on a standardized test like the SAT, this number applies to all administrations of the test; a 65th percentile score means that you scored better than 65% percent of test-takers, period – not just those who took the test on the same day that you did but on every administration of that test.
This consistency is what makes a test ‘standardized’ – the scoring of standardized tests is carefully adjusted each time these tests are given so that a score on any administration of that test can be directly compared to a score from any other administration of that test with no adjustment.
In practical terms, an SAT score of 1000 in December of 2016 is equivalent to a score of 1000 in January of 2017 – and all other SATs (at least since the test moved back to a 1600-point scale from a 2400-point scale).
[leadmagnet_five]
The purpose of this data-intensive standardization process is to ensure that the SAT remains a useful tool for colleges in their effort to gauge students’ readiness for higher education.
When admissions committees evaluate applications, they can be confident that this year’s 1200 is very close to last year’s 1200, and that this year’s 99th percentile is very close to last year’s 99th percentile.
So, your percentile score represents the percentage of other test-takers that you beat, and because the SAT is standardized, your SAT percentile score compares accurately to all test-takers, not just the ones who took it when you did. Got it. But how does this percentile score relate to what we think of as our actual SAT score – the scaled score, out of 1600?

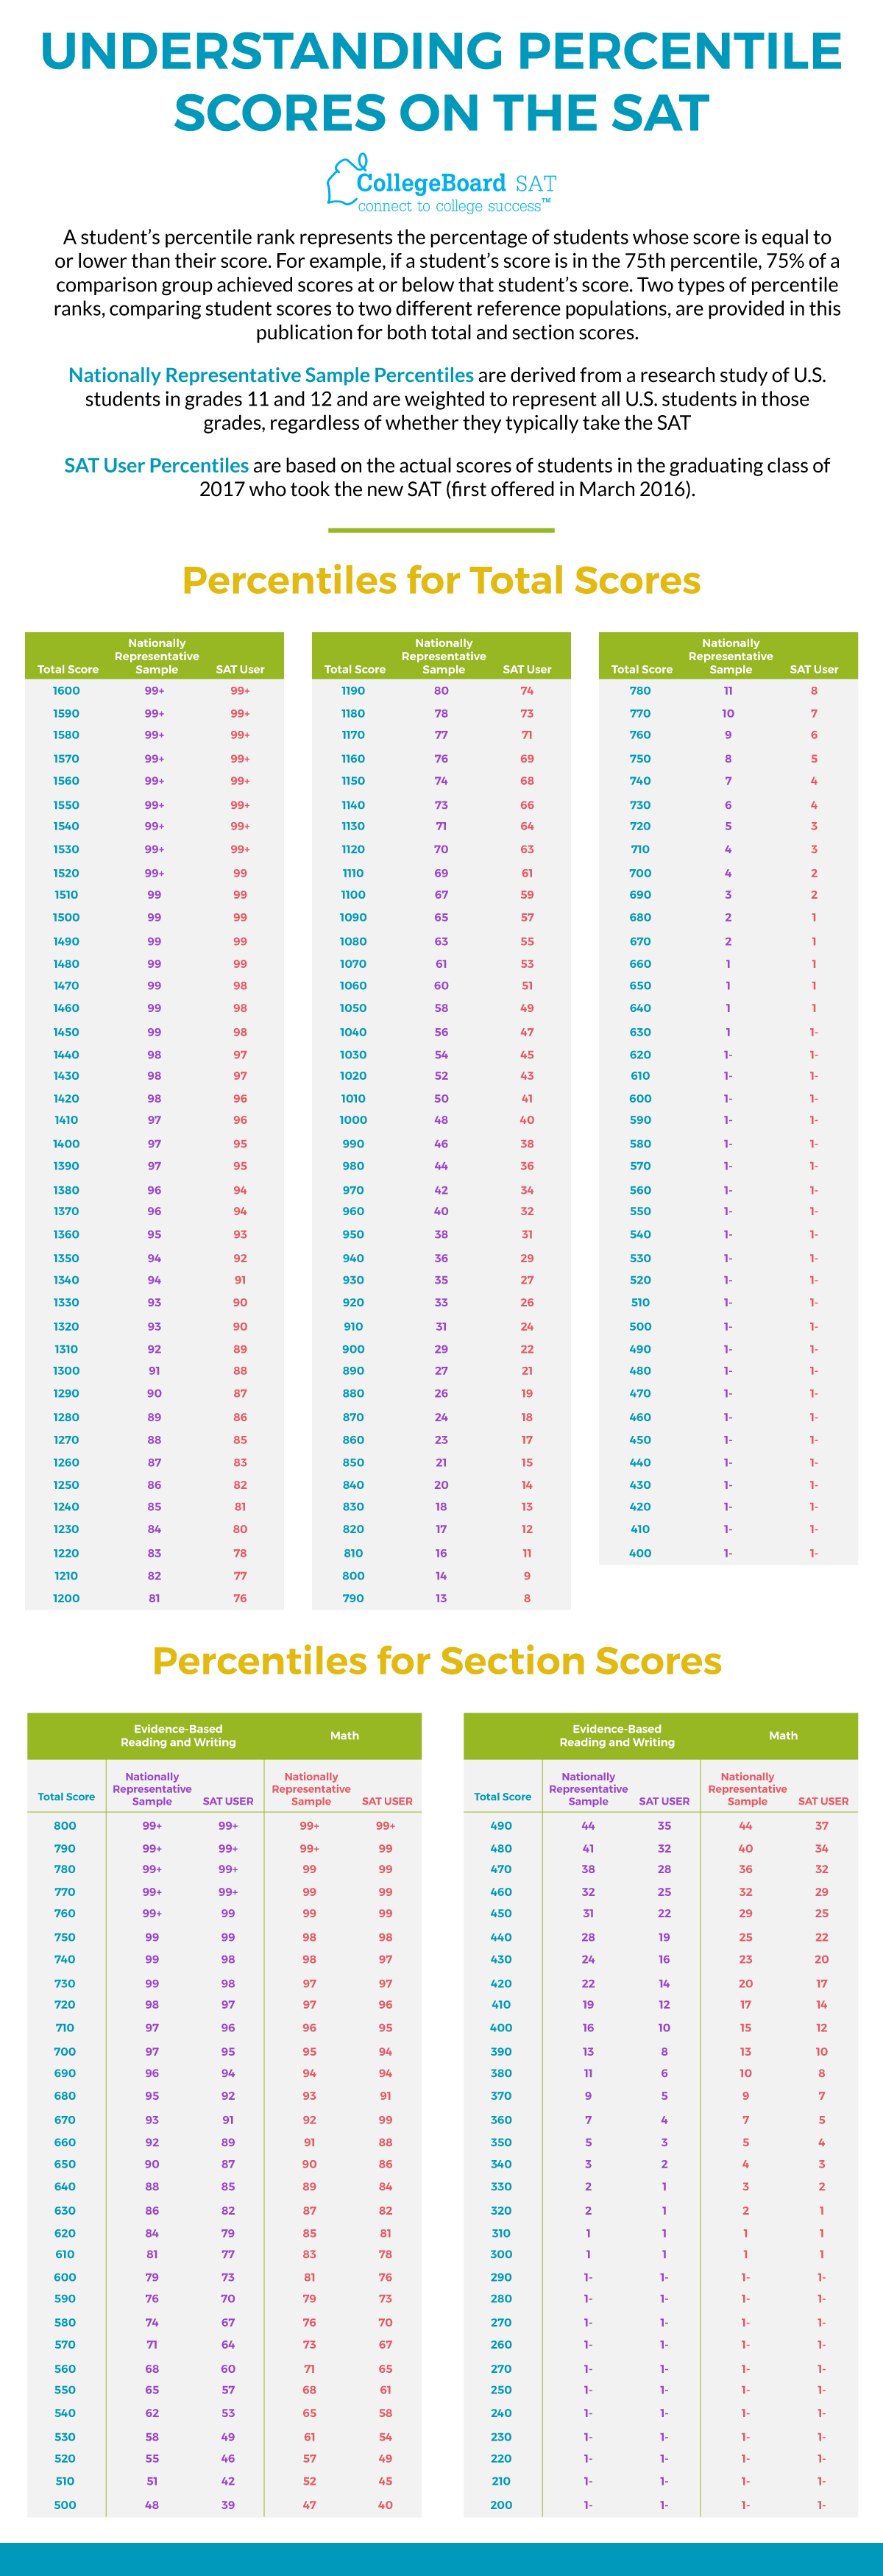
How Do Percentile Scores Equate To Scaled SAT Scores?
The short answer is: on a bell curve.
Because such a large number of students take the SAT, the overall distribution of scores tends to approach what is known as a normal distribution – the graph of which is the classic bell curve.
In a normal distribution, many data points fall near the middle of the scale, the average value of the quantity being measured is fairly stable, and few data points fall near either end of the scale.
Many different measurements of human performance, such as SAT scores, have long been mapped and analyzed within this framework. Most people will tend to be near average in terms of their performance, while a small number of people perform very poorly and a small number of people perform very well.
With regard to the SAT, the practical meaning of the normal tendencies of scores is this: most test-takers score somewhere near the average, and as we approach each end of the scoring scale, the number of test-takers who achieve a given score drops significantly, eventually approaching zero.
For instance, only an estimated 0.02% of test-takers will attain a perfect score on any SAT like our founder, Shaan Patel – that’s about one in five thousand people. Meanwhile, the majority of test-takers will score at or near the median: about 50% of all test-takers will score between an 800 and 1100.
A graphical representation of the change in percentile score plotted against the change in scaled score. The height of the line represents the number of students who achieve this score; many students score near the middle of the scale, but very few students achieve scores falling at either extreme of the scale.
So, you understand now what a percentile score is, and how it relates to your SAT scaled score: in short, few students who take the SAT score very poorly, and few score very well, while most score somewhere near the middle.
The number of students who earn a particular score gets smaller and smaller as we approach either end of the scale. Okay, but why are there two percentile scores? What’s the difference between them?

Understanding Your SAT User Percentile And Your NRSP
The two percentile scores you receive on your SAT have been created for different purposes, and have different meanings.
As it turns out, all percentile scores are not created equal. One will be more important to you than another.
The first and simplest percentile score we will discuss is the SAT User Percentile score. This number has essentially the simple meaning I have discussed in this post up to now: it measures the percentage of other SAT users that you outperformed when you took the test.
An SAT user is defined as a junior or senior in high school who intends to enroll in college. Thus, if you scored in the 89th percentile, you did better than 89% of other students who took the SAT as a junior or senior and planned to use their score in applying to colleges.
Clearly, this number is meaningful to you as the test-taker: it gives you a simple and accurate measurement of how your performance on the test compares to the rest of the students who took it.
The other SAT percentile score is less straightforward and, I think, less useful. It is known as the Nationally Representative Sample Percentile (NRSP) and has been created for a slightly different purpose.
While the SAT User Percentile, as just mentioned, is based on a comparison between your score and those of other college-bound juniors and seniors who took the SAT, the NRSP represents an estimate of how your score would compare with all high school juniors and seniors – including those who have not actually taken the SAT and/or do not intend to enroll in college.
Obviously, any estimate of how students who do not actually take the SAT might have scored if they had in fact taken the SAT amounts to, at best, sophisticated guesswork. It is possible that the College Board, in creating the NRSP, makes this estimate very accurately.
Unfortunately, because they do not publish their methods, there is no way to know. In truth, however, it does not much matter. College admissions committees overwhelmingly tend to rely on the SAT User Percentile rather than the NRSP, and will probably continue to do so.

Why Is My NRSP Higher Than My SAT User Percentile?
Your NRSP will be slightly higher than your SAT User Percentile.
Why? Because the group of students included in the NRSP but not in the SAT User Percentile – who, remember, either have not taken the SAT and/or do not intend to enroll in college – would likely (in the estimation of the College Board, at least) score poorly compared to their college-bound peers.
So, you are now you are an expert on SAT percentile scores. You know what the NRSP means, what the SAT User Percentile means, how each is derived, and which is more important. But why should you care?
[sat_two]

Why Do Percentile Scores Matter?
There are several reasons why you need to understand your percentile scores and how they relate to your scaled score.
One major reason is that we must understand what our scaled score means in order to set reasonable and productive expectations for our studying and practice.
Any description of a scaled score that does not take into account its relationship to a percentile score is inherently incomplete. In more practical terms, there are important and common questions that students have which require an understanding of percentile scores to fully answer.
What kind of improvement should a student in Prep Expert’s online SAT course expect? How good is 1220? Does Prep Expert®’s industry-leading 200-Point Score Increase Guarantee apply equally across the entire scoring scale?

Is My SAT Score Good?
One of the most common questions we get at Prep Expert® from students in our in-person and online SAT courses goes something like this: is score X good?
We cannot give you a simple answer to this question (and neither can anyone else; distrust any person or company who tells you they can).
We can, however, translate this arbitrary, abstract scaled score into concrete terms. Is a 1220 good? Well, that depends on the student and his or her capabilities. For our founder Shaan Patel, 1220 would not be good – because, as he proved, he is capable of a perfect score.
But if you approach me with a 1220 and ask me whether you should be pleased, the first thing I will tell you is that 1220 equates to roughly the 84th percentile on the new SAT. I’ll then ask you if you think that reflects well on your abilities, if you are pleased having beaten 84% of the other students who took the test.
In my experience, this concrete approach based on percentiles is much easier to digest and ultimately more meaningful for students and parents; it tends to provide better intrinsic motivation for students to prepare for the test and better feedback for their parents about the student’s performance and progress.

My SAT Score Went Up X Points – How Good Is That?
Similarly, any discussion Of improvement in a student’s SAT score should take into account percentile scores.
For instance, how meaningful is an improvement of 100 points? Again, don’t be satisfied with an easy answer to this question – unless it considers percentile scores, any response is likely to be at least incomplete and at worst misleading.
Specifically: an improvement of 100 points from 1480 to 1580 would correspond to an improvement of less than 1.5 percentile points, while an improvement from a 900 to 1000 would correspond to an improvement of roughly 18 percentile points.
This would represent an actual improvement that is twelve times greater in terms of comparative performance against other students. What seems more meaningful to you – 100 points, or 18 percentile points?
As you might have guessed by now, I think percentile scores are more meaningful, straightforward, and important than scaled scores. I will stop short of encouraging you to disregard your scaled score and pay attention only to your percentile score.
I think that the testing, test prep, and college admissions communities are so used to speaking and thinking in terms of scaled scores that it would be difficult and probably counterproductive to ignore them entirely.
If you have followed this discussion, however, you now understand percentile scores – what they mean, how they are derived, and how useful they can be in measuring performance and progress. In future posts, I will break down the other scores associated with the SAT and the meaning and importance of each.
[sat_three]
For more test strategy, college admissions, and scholarship application tips sign up for our FREE class happening right now!
Written by Todd Marcus
More from Todd Marcus


Taking The ACT Junior Year
If you're ambitious and want to give yourself plenty of time for score improvement, then consider taking the ACT junior…

ACT 2020 Score Release Dates
Here then are the ACT 2020 score release dates to plan around, as well as, the different kinds of available…

How To Determine Your Average SAT Study Time
If you want a high score on the SAT, then you need to put in the hours. There's no way…