What’s The Average SAT Score?

The “average SAT score” depends on a lot on which test version you took, which year you took it in, and a number of other factors.
At Prep Expert®, we offer great SAT prep courses to help your child earn the best score possible.
[sat_one]
For an idea of what the average SAT score looks like across the United States, we have that covered in the infographic below:
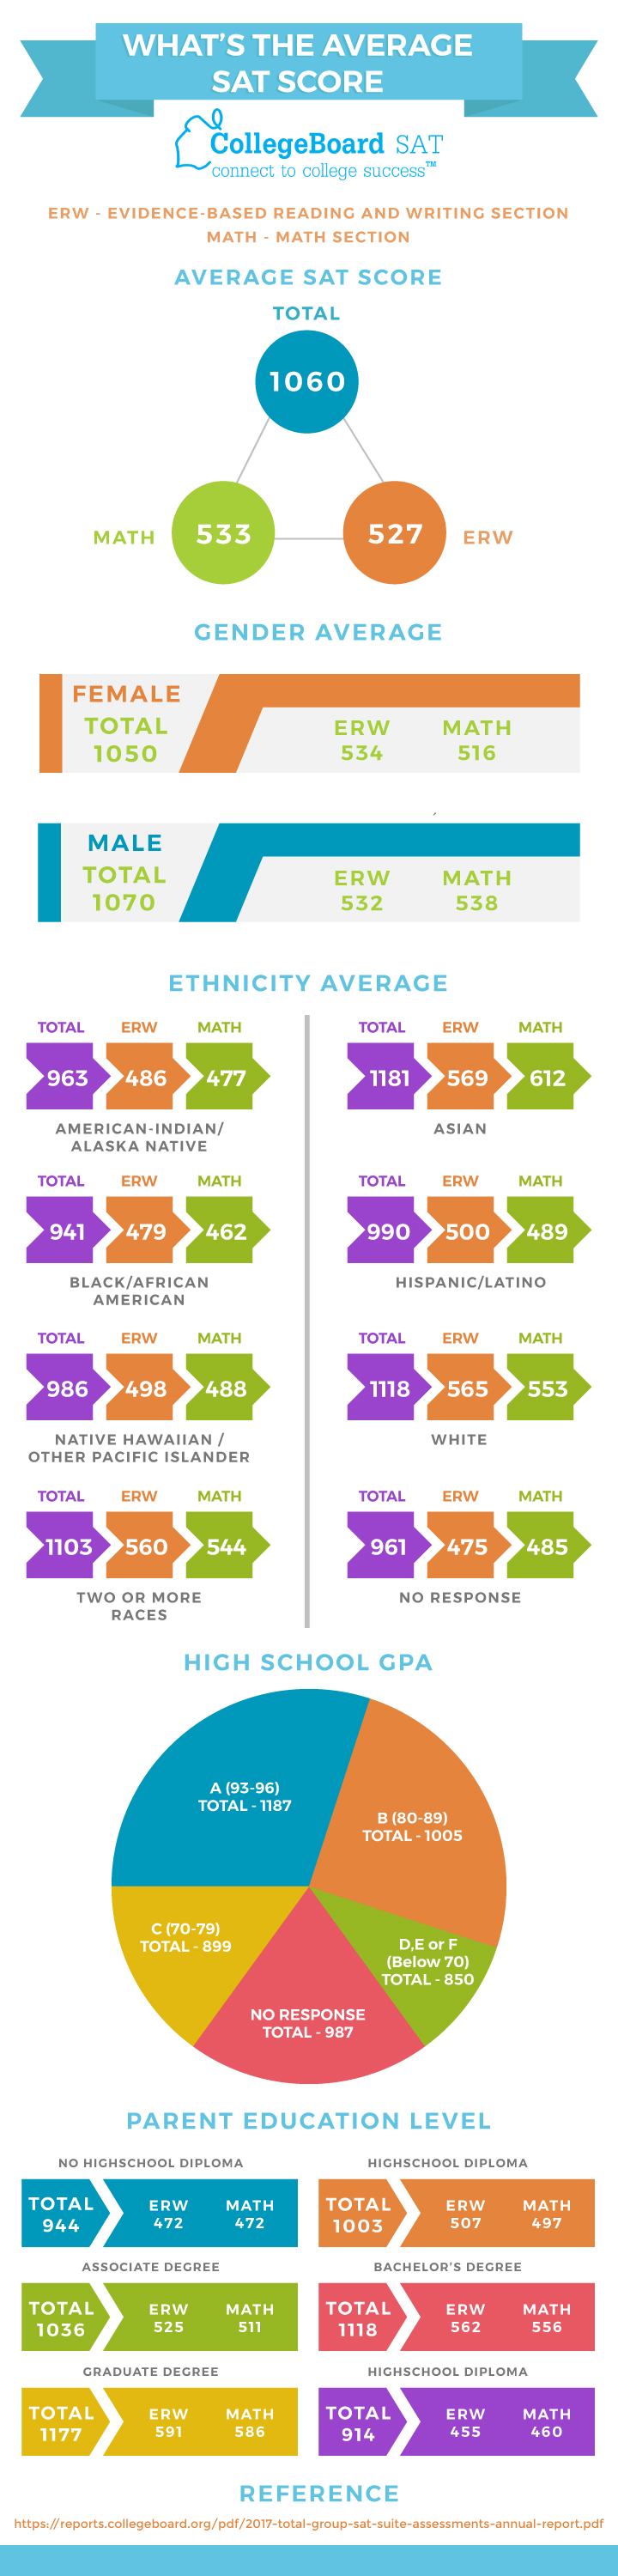
National SAT Average Score
| Total | ERW | Math |
|---|---|---|
| 1060 | 533 | 527 |
*ERW – ‘Evidence-Based Reading and Writing Section’
SAT Average Score By Sex
| Sex | Percent | Total | ERW | Math |
|---|---|---|---|---|
| Female | 53% | 1050 | 534 | 516 |
| Male | 47% | 1070 | 532 | 538 |
SAT Average Score By Ethnicity
| Ethnicity/Race | Percent | Total | ERW | Math |
|---|---|---|---|---|
| American Indian/Alaska Native | 0% | 963 | 486 | 477 |
| Asian | 9% | 1181 | 569 | 612 |
| Black/African American | 13% | 941 | 479 | 462 |
| Hispanic/Latino | 24% | 990 | 500 | 489 |
| Native Hawaiian/Other Pacific Islander | 0% | 986 | 498 | 488 |
| White | 44% | 1118 | 565 | 553 |
| Two or More Races | 3% | 1103 | 560 | 544 |
| No Response | 5% | 961 | 475 | 485 |
SAT Average Score By High School GPA
| Grade | Percent | Total | ERW | Math |
|---|---|---|---|---|
| A+ (97-100) | 6% | 1254 | 626 | 628 |
| A (93-96) | 18% | 1187 | 595 | 592 |
| A- (90-92) | 17% | 1122 | 564 | 558 |
| B (80-89) | 41% | 1005 | 508 | 497 |
| C (70-79) | 10% | 899 | 456 | 444 |
| D, E, or F (below 70) | 1% | 850 | 429 | 421 |
| No Response | 7% | 987 | 489 | 498 |
SAT Average Score By Parent Education Level
| Highest Parental Education Level | Percent | Total | ERW | Math |
|---|---|---|---|---|
| No High School Diploma | 8% | 944 | 472 | 472 |
| High School Diploma | 28% | 1003 | 507 | 497 |
| Associate Degree | 8% | 1036 | 525 | 511 |
| Bachelor’s Degree | 28% | 1118 | 562 | 556 |
| Graduate Degree | 20% | 1177 | 591 | 586 |
| No Response | 9% | 914 | 455 | 460 |
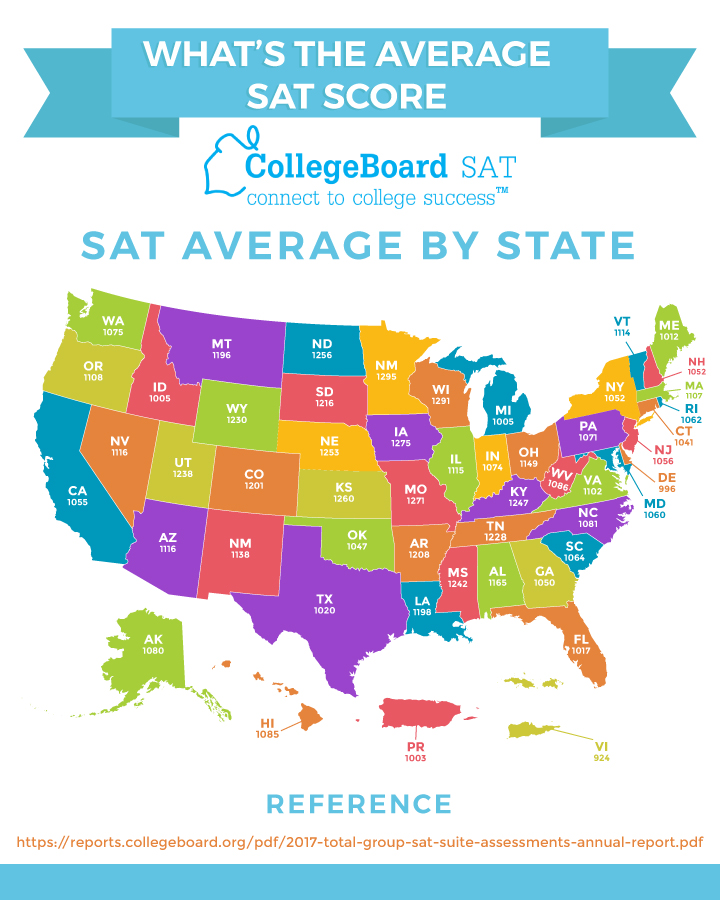
SAT Average Score By State & US Territory
| State | Number of Testers | ERW | Math | Total |
|---|---|---|---|---|
| Alabama | 2,393 | 593 | 572 | 1165 |
| Alaska | 2,971 | 547 | 533 | 1080 |
| Arizona | 20,466 | 563 | 553 | 1116 |
| Arkansas | 1,065 | 614 | 594 | 1208 |
| California | 226,699 | 531 | 524 | 1055 |
| Colorado | 5,896 | 606 | 595 | 1201 |
| Connecticut | 43,252 | 530 | 512 | 1041 |
| Delaware | 10,060 | 503 | 492 | 996 |
| District of Columbia | 4,801 | 482 | 468 | 950 |
| Florida | 147,058 | 520 | 497 | 1017 |
| Georgia | 63,805 | 535 | 515 | 1050 |
| Hawaii | 7,352 | 544 | 541 | 1085 |
| Idaho | 18,757 | 513 | 493 | 1005 |
| Illinois | 12,402 | 559 | 556 | 1115 |
| Indiana | 45,622 | 542 | 532 | 1074 |
| Iowa | 861 | 641 | 635 | 1275 |
| Kansas | 1,199 | 632 | 628 | 1260 |
| Kentucky | 1,608 | 631 | 616 | 1247 |
| Louisiana | 1,696 | 611 | 586 | 1198 |
| Maine | 13,826 | 513 | 499 | 1012 |
| Maryland | 42,919 | 536 | 524 | 1060 |
| Massachusetts | 56,024 | 555 | 551 | 1107 |
| Michigan | 110,082 | 509 | 495 | 1005 |
| Minnesota | 2,061 | 644 | 651 | 1295 |
| Mississippi | 716 | 634 | 607 | 1242 |
| Missouri | 1,990 | 640 | 631 | 1271 |
| Montana | 990 | 605 | 591 | 1196 |
| Nebraska | 680 | 629 | 625 | 1253 |
| Nevada | 6,245 | 563 | 553 | 1116 |
| New Hampshire | 14,758 | 532 | 520 | 1052 |
| New Jersey | 72,173 | 530 | 526 | 1056 |
| New Mexico | 2,342 | 577 | 561 | 1138 |
| New York | 135,141 | 528 | 523 | 1052 |
| North Carolina | 49,595 | 546 | 535 | 1081 |
| North Dakota | 123 | 635 | 621 | 1256 |
| Ohio | 14,545 | 578 | 570 | 1149 |
| Oklahoma | 2,776 | 530 | 517 | 1047 |
| Oregon | 15,866 | 560 | 548 | 1108 |
| Pennsylvania | 89,218 | 540 | 531 | 1071 |
| Puerto Rico | 2,913 | 515 | 487 | 1003 |
| Rhode Island | 7,205 | 539 | 524 | 1062 |
| South Carolina | 22,292 | 543 | 521 | 1064 |
| South Dakota | 237 | 612 | 603 | 1216 |
| Tennessee | 3,495 | 623 | 604 | 1228 |
| Texas | 204,409 | 513 | 507 | 1020 |
| Utah | 1,277 | 624 | 614 | 1238 |
| Vermont | 4,303 | 562 | 551 | 1114 |
| Virginia | 57,453 | 561 | 541 | 1102 |
| Virgin Islands, US | 752 | 483 | 442 | 924 |
| Washington | 43,911 | 541 | 534 | 1075 |
| West Virginia | 2,406 | 558 | 528 | 1086 |
| Wisconsin | 1780 | 642 | 649 | 1291 |
| Wyoming | 144 | 626 | 604 | 1230 |
SAT Score Changes And Background
It’s important to note that the total number of possible SAT points has changed several times over the past few years.
For a long time, the exam was based out of 1600 points. However, ten years ago, the College Board made the essay section mandatory and added it to students’ scores.
This addition increased the potential point total to 2400. Then, responding to ACT competition, the SAT was again revised. This time, the essay section became optional again, reverting the highest possible score total back to 1600.
[sat_two]
For the revised SAT, the average student received:
- A score of 1060
- The Top 25 percent of test-takers receive a 1200 or higher
- The bottom 25 percent score an 840 or below
The lowest possible score on the new SAT is a 400 (200 base points for Evidence-Based Reading and Writing, and 200 for Math).

Average SAT Scores For State School Admissions & Scholarship Programs
One reason you might be wondering about the average SAT score is because you’re applying for admission to state schools, or applying to state-specific scholarship programs.
If so, and you think you need to improve your score, visit our SAT prep courses and see what’s available before your next test!
A state’s average SAT score is affected by a variety of factors such as:
- Size
- Total Number of Student Exam Takers
- Educational System Quality
So, based on the numbers above, if you’re applying to a college, university, or scholarship program in a state like Massachusetts, you face a more competitive environment than a student in, say, Louisiana.
Why? Because of the massive difference in the number of test-taking students in each state.
Just keep in mind, in these situations, it’s your state’s average SAT score, not the national average, that matters.

Now, How Much Does This All Matter?
Other than for the reasons mentioned above, not much.
And that’s because overall, college and university admissions officials care little about national or state average SAT scores.
What colleges and universities care most about is the average SAT score of the students that apply to their schools.
Generally, for more competitive schools, the average SAT score of admitted students will be higher than for less-competitive schools.

Where Do I Find This Information?
Most schools’ admissions websites will have score bands showing the average SAT scores of admitted students.
Typically, these bands will list the average scores for the 25th percentile, 50th percentile and 75th percentile of admitted students. Because your SAT score isn’t the only number admissions officers will be looking at.
Your GPA also plays a role in how close to a particular percentile you’ll need to be in order to gain admission.
Of course, it’s always best to shoot for the 50th percentile or higher. But, if you have a very high GPA, you could get away with having an SAT score closer to the 25th percentile at a particular school and gain admission.
Conversely, students with comparatively low GPAs will want to shoot for the 75th percentile of SAT scores to remain competitive candidates. The biggest takeaway is that neither score alone seals your admissions fate, but it’s better to boost both as much as possible for the best competitive edge.
Another excellent resource for this sort of information is your high school guidance counselor. At most high schools, the guidance office will have records of all the students from your school who applied to specific colleges and universities, and were:
- Admitted
- Rejected
- Waitlisted
This information also includes those students’ average GPAs and SAT scores. At some schools today, this information is available online, through programs like Naviance.
Using this data, you can get an idea of what some colleges and universities are realistically looking applicant-wise, and what you’ll need to do to fit.

What’s The Average Score For My Dream School?
Below is a list of some of the most competitive colleges and universities, ranked in the order of highest 75th percentile SAT score to lowest:
| Rank | School | Average SAT Score |
|---|---|---|
| 1 | CalTech | 1534 |
| 2 | University of Chicago | 1504 |
| 3 | MIT | 1503 |
| 4 | Harvard | 1501 |
| 5 | Yale | 1497 |
| 6 | Princeton | 1495 |
| 7 | Vanderbilt | 1475 |
| 8 | The University of Washington | 1474 |
| 9 | Columbia | 1471 |
| 10 | Stanford | 1466 |
| 11 | Northwestern | 1458 |
| 12 | Rice | 1454 |
| 13 | Pomona | 1454 |
| 14 | Notre Dame | 1450 |
| 15 | Dartmouth | 1446 |
| 16 | Duke | 1444 |
| 17 | The University of Pennsylvania | 1442 |
| 18 | Williams College | 1439 |
| 19 | Amherst | 1434 |
| 20 | Carnegie Mellon | 1432 |
| 21 | Tufts | 1428 |
| 22 | Brown | 1425 |
The schools with the highest 75th percentile scores aren’t necessarily the most competitive – those numbers are based on how many students are admitted out of those who apply.
These percentiles do affect a school’s U.S. News and World Report ranking, though, so colleges and universities definitely care about how they stack up there.
Remember, your SAT score isn’t the only thing colleges and universities look at when they evaluate your application. They’re also looking at:
- GPA
- High School Curriculum Competitiveness & Rigor
- Athletics & Extracurricular Activities
- Recommendation Letters
- Personal Statement
So, don’t focus too much on this one number. It’s one piece of the admissions puzzle. You’ll be better served by working on building up your score but also by working on other package pieces:
- Letters of recommendation
- Your extracurricular activities

Where Should I Apply, Based On My SAT Score?
There are lots of things you should take into account when deciding which schools to apply to. Examples include:
- Interested Subject of Study
- Finances
- Location
- School Size
Talking purely about SAT scores, though, you should make a list of between nine and 12 schools, among three categories:
- Safety Schools – schools where your SAT score (and GPA) are in the 75th percentile of scores
- Competitive (aka ‘Target’) Schools – schools where your scores are around the 50th percentile mark
- Reach Schools – schools where your scores are at either the 25th percentile mark or below
Try to have between three to four schools in each category to ensure you’ll be admitted somewhere for the fall.

Things To Keep In Mind
There are two major points to keep in mind when absorbing all this information:
Average scores are based on the results of past administrations of the SAT – The average SAT score for the particular exam administration you’re sitting for this time around will be different than the average scores you’re looking at now.
When the results of your test are released, averages could go up or down (although chances are that they won’t fluctuate all that much).
[leadmagnet_two]
When it comes to particular schools, the average scores for admitted students change from year to year, and the trend is almost always up – If a particularly large number of students apply to a school in a given year, the average SAT score of admitted students could go way up, making that school much tougher to get into.
So when you make your list, it’s probably a good idea to have at least a few ‘target’ schools where you’re closer to the 60th-70th percentile of SAT scores.

How Do I Improve My Score?
As always: study, study, study.
Get a handle on the underlying academic concepts tested on the SAT, and bone up on the areas where you’re deficient. Then, you might want to consider signing up for a prep course, like those offered by Prep Expert®.
[sat_three]
For more test strategy, college admissions, and scholarship application tips sign up for our FREE class happening right now!
Average SAT Score FAQ
What is the average SAT score?
1060
What is the average SAT Math score?
527
What is the Average SAT ERW score?
533
What is the lowest possible SAT score?
The lowest possible score on the new SAT is a 400 (200 base points for Evidence-Based Reading and Writing, and 200 for Math).
Written by Dr. Shaan Patel MD MBA
Prep Expert Founder & CEO
Shark Tank Winner, Perfect SAT Scorer, Dermatologist, & #1 Bestselling AuthorMore from Dr. Shaan Patel MD MBA


The Week Before the SAT: What Should You Actually Be Doing?
After months of preparing for the SAT, the final week can feel surprisingly stressful. You might wonder if you should…

SAT vs. ACT in 2026: Which Test Should You Actually Take?
The most common question I get from families starting college prep is which test their student should take. The most…

SAT 1-2-3: How Many Questions Are On The SAT (And Other Important Numbers)
College applications can feel like a numbers game, but don’t count yourself out if things aren’t adding up! When it…